CUSABIO는 암, 세포 생물학, 면역학, 신경과학, 후생유전학 등 연구 분야의 글로벌 고객에게 60,000개 이상의 검증된 항체, 10,000개 이상의 재조합 단백질, 660개 이상의 사이토카인 및 수천 개의 ELISA 키트를 제공하는 검증된 제조업체 입니다. 다양한 과학 연구 분야에서 고객의 폭 넓은 요구를 충족시킬 수 있는 Cusabio의 제품을 만나보세요.
ELISA 데이터 분석 만들기 - 가이드라인
Targen Proteins의 농도 계산과 ELISA Standard curve를 제작하는 가이드라인을 확인해보세요!
- Guide to make ELISA standard curve and calculate concentration of target proteins
ELISA assay is used for determining the concentration of target protein in biological samples. Three types of ELISA data output can be yielded.
Quantitative: A standard curve can be generated by ODs of serial diluted standard proteins and corresponding known concentrations. ELISA data of samples can be interpolated from standard curve to calculate the concentrations of target proteins in samples.
Qualitative:we simply get a negative or positive result from the assay to determine whether there is any target protein existing in a certain sample by comparing to the negative control.
Semi-Quantitative: With this type of ELISA kit, we are able to get a negative or positive result as well as to compare the target protein levels in assay samples, since the level of samples'absorbance will directly correspond to the level of target protein concentration. However, we can't calculate the exact concentration since there isn't any standard protein in the kit.
Generally speaking, with quantitative ELISA kit, you can quantify target protein in samples since you test a serial of standard proteins of known concentration. When you analyze ELISA data with quantitative ELISA kit, you have to plot the mean absorbance against the protein concentration and draw a curve fitting your standard result best, and then interpolate absorbance of samples to the curve to calculate the concentration. This ELISA standard curve protocol will give you a comprehensive instruction on how to calculate ELISA results with quantitative ELISA kit step by step.
Firstly, you need to run the ELISA kit according to our guide of plate layout and get raw data from ELISA reader, and then let's go to the next step—statistical analysis of ELISA results, which is the last and the key step to get the concentration of target protein in your samples. We recommend you an ELISA data analysis software curve expert 1.4 that is simple to use and you can download at the end of this page to process data calculation. There are many other curve fitting softwares available in the market to conduct ELISA calculation as well such as GraphPad Prism or you can also use normal MS Excel for analysis.
There are three steps to process ELISA data analysis.
Now I will show you how to make an ELISA standard curve step by step.
You can also watch this video at first.
1. Input ELISA data of standard into software
After running up the ELISA assay, you can separate your raw data into three parts. It is recommended to run standards and samples in duplicate or triplicate. As a best practice, you'd better control the CV of replicates less than 8%.
Standards are serially diluted with Sample Diluent. Samples may also need to be diluted. Since sample diluent has absorbance even when there is no protein present at the detection wavelength, we run blank well with sample diluent in the assay to get the background OD. It is common practice to subtract the absorbance of the blank well from standards and all sample absorbance.
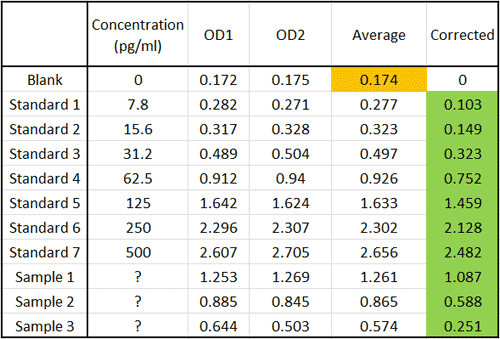
Take Human TNF-α ELISA kit (CSB-E04740h) as an example. Absorbance of both standards and samples are corrected by subtracting OD of blank well.
Here we use "Curve Expert 1.4" as an example to show you how to operate the software and process data analyzing.
1.1 Start "Curve Expert 1.4". You can see an interface below.
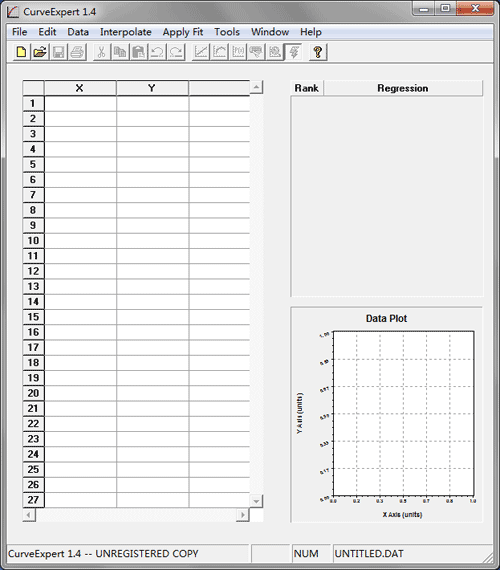
1.2 Input OD values (X-axis) and corresponding concentration (Y-axis) of standards. You can copy the data from excel sheet directly to the worksheet in the software. Data plot appears in the lower right corner.

2. Choose the best fitting curve
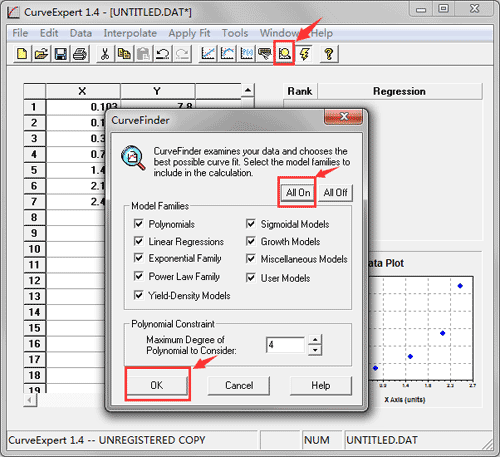
2.1 Click [ Run ] button and let software examine your data to choose the best possible curve fit. Select the model families to include in calculation. Usually, we click [ All On ] to include all model families. If the polynomial family is included for consideration, you must specify the maximum degree of the polynomial that software will consider in the "Polynomial Constraint" area. We recommend setting the maximum degree of polynomial as “4”. Of course, if the polynomial family is not included, the polynomial constraint will simply be ignored. Then press [ OK ].
2.2 The calculation will then proceed, and each curve fit is ranked according to its standard error and correlation coefficient, and the best fit is then displayed in the graphing window.
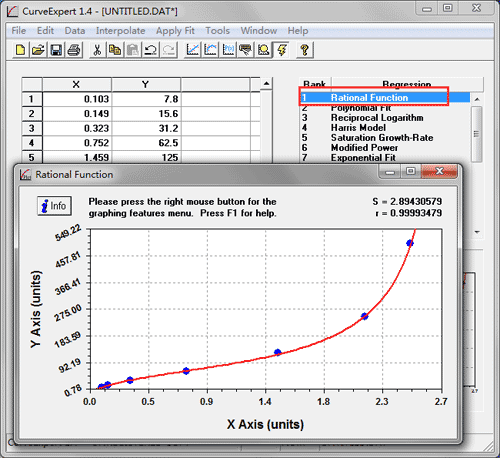
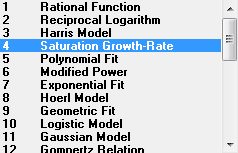
Though the software will recommend the best fitting curve, you can still select curve manually by double clicking different regression. Select the curve with “r” value closest to “1”.
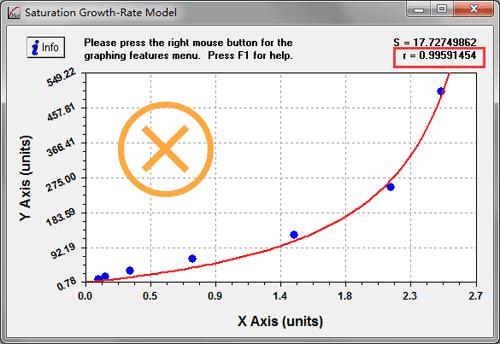

Selecting an appropriate curve-fitting regression is important since concentration of samples will be calculated according to the standard curve. The following figures illustrate how different ELISA standard curves affect the accuracy of concentration calculations. The closer “r” value is to “1”, the stronger correlation there is between OD and concentration.

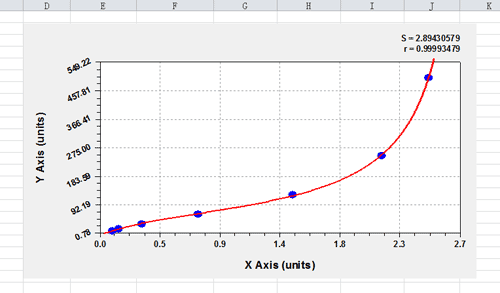
This is an example to show you how different standard curves affect result. If a test sample produces an absorbance of 1.4, the corresponding two concentrations calculated by linear curve (r= 0.92255796) and nonlinear curve (r= 0.99993479) have a huge difference (199.955 VS 114.898).
In this example we finally select “Rational Function” since its “r” value is closest to “1” compared with other standard curves. By pressing the right mouse button or by pressing Ctrl-M in any graphing window, you can pick from the graphing menu. By clicking [ Copy ] button you can paste standard graph to excel sheet or word document.
3. Calculate the concentration of target protein by interpolation
How to calculate concentration? You have two ways to calculate the concentration of target protein.
The software allows easy location of x/y points, differentiation, and integration of a curve fit that has been performed by choosing Analyze from the graphing menu or pressing Ctrl-L. In this example we would like to find the concentration of target protein (Y value) by evaluating the curve fit at a given OD (X value). Just type in the point at which you want to evaluate the curve fit (the x value) in the "At X=" field and press [ Calculate ] or [ Enter ] on your keyboard. The calculator will then show the corresponding y value.

Press [ Info ] button to open model information dialog which gives all of the information needed to apply a curve fit and some supplemental information about the performance of the given model. The most important information contained in this panel is the values of the parameters of the model.

Model
The Model section gives the data modeling equation so that the interpretation of the coefficients is clear. The coefficients a, b, c, etc. in the Coefficients section match the corresponding parameters shown in the model.
Coefficients
The Coefficients section gives the values of the relevant parameters for the current model -- these coefficients are always expressed as a, b, c, d, and so on. These coefficients match the model shown in the Model section. If the list of coefficients exceeds the extent of the window that they are shown in, a scrollbar will appear to allow you to scroll through the parameters.
If we click [ Copy ], the list of coefficients is copied to the clipboard. Then paste them in any Excel sheet

Bring X (OD), a, b, c, d value into the formula respectively and then press [ Enter ] on your keyboard to calculate concentration. To get the most accurate results, it is recommended to do a pre-text to determine the appropriate dilution factor to make sure that the concentration of target protein in the samples after dilution falls into the range of standard curve. If the sample has been diluted, the dilution factor should be taken in to account during calculation.


Standard curve is so important to get ELISA results analysis accurately. Therefore, you should run standards in each assay to avoid systematic deviation caused by difference on operator, pipetting, incubations, and temperature of each assay.
Please download Curve Expert1.4.zip
"Curve expert 1.4" is not compatible with Macs.
If you need the software for Macs, you can download here:
http://download.cnet.com/CurveExpert-Professional/3000-2054_4-75332285.html
It is a paid software. If you are not willing to use it, you can make the standard curve by Excel or other softwares, or you can send us your data and we will process the data for you.